The ultimate guide to enterprise AI model evaluation

Successful enterprise AI deployment requires a shift from static benchmarks to end-to-end validation of agentic AI workflows. Surgical gap analysis and continuous monitoring of outputs can reduce training data needs by up to 95%.  

Table of contents

Key Points

The ultimate guide to enterprise AI model evaluation
00:00
/
00:00

You roadmap to AI model validation: From pilot purgatory to production ROI

In 2026, the success of enterprise AI is no longer measured by the wow factor of a demo, but by the reliability of the AI agents running within your pipelines. While investment in generative AI continues to climb, a significant ROI gap has emerged. According to a16z’s 2026 enterprise survey, only about one-third of organizations have successfully transitioned their pilots into profitable production environments.

This stall is why Gartner predicts that 30% of generative AI projects will be abandoned by the end of 2026 due to poor data quality, escalating latency, and a failure to move beyond brittle prototypes. To bridge this gap, TPMS and vendor ops leaders must look beyond basic metrics and implement a holistic validation strategy that treats evaluation as the architect’s blueprint for the entire AI strategy.

How do you evaluate AI models for enterprise agentic workflows?

To move an AI agent into production, evaluation must shift from static benchmarks to real-world validation of the entire system. This involves measuring how LLMS interact with APIS, the accuracy of retrieval-augmented generation (RAG) steps, and the reliability of multi-step automation workflows. By establishing a technical baseline that mirrors actual business objectives, ops leaders can build trust with stakeholders and ensure AI deployment delivers measurable business value.

Model evaluation for end-user needs

Leading AI systems and machine learning teams ensure that validation begins at the roadmapping stage, moving beyond feature requests to an in-depth analysis of real-world workflows. When you skip this step, you risk deploying AI applications that fail to integrate with existing pipelines, leading to low AI adoption and project abandonment.

For example, if a team is architecting an agentic AI model to assist investors at a finance organization, the validation must go deeper than text quality. You must define how the agent interacts with legacy APIS and whether the outputs should be structured as a JSON object for a dashboard or a natural language summary. Evaluating for the end user also provides a clear baseline for data quality, free from the assumptions of those who won't be managing the deployed automation.

While the specific metrics depend on the use cases, ops leaders should use these questions to guide their validation strategy:

  • Business impact: How will this agent streamline the current process? Will it reduce latency, improve precision in a specific task, or lower the TCO of the workflow?
  • Workflow integration: What does the existing technical stack look like, and how will the model embed within current AI platforms or Microsoft ecosystems?
  • Output specifications: If the algorithms deliver data, what is the most reliable format to ensure downstream decision-making is AI-driven and accurate?

How to evaluate foundation generative AI models for your specific task

With the proliferation of powerful LLMS and computer vision models trained on internet-scale datasets, building a base model from scratch is rarely the most cost-effective path for enterprise AI developers. Choosing the right foundation models—those that already deliver outputs closest to your business objectives—can significantly reduce training data requirements and overall AI deployment timelines.

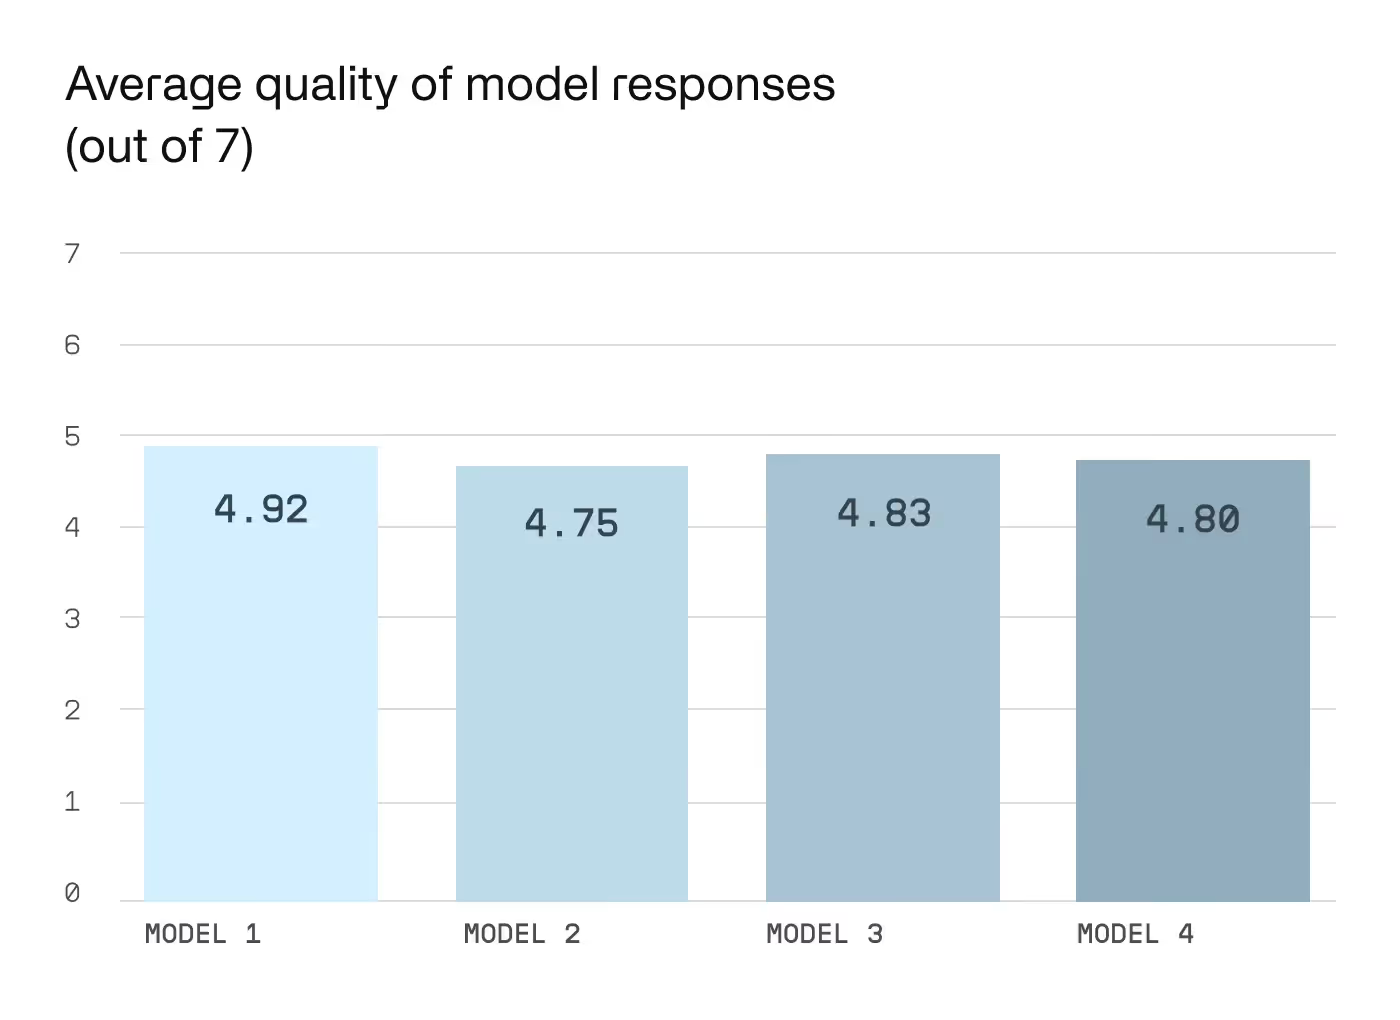
To find the right fit, you have to compare multiple AI models on metrics directly tied to their real-world use cases. While it is tempting to rely on high-level benchmarks like general accuracy, drilling down into specific task performance reveals the true TCO and the AI training journey ahead.

For instance, when evaluating LLMs for an investor assistant agentic AI, a general "average response quality" score is a poor baseline. These results are often subjective and fail to show how well a model handles the complex logic and APIS required for financial automation.

Comparing AI models on average response quality delivers high level benchmarking, but it doesn’t reflect responses to any specific tasks related to our use case

Moving from benchmarks to error-type validation

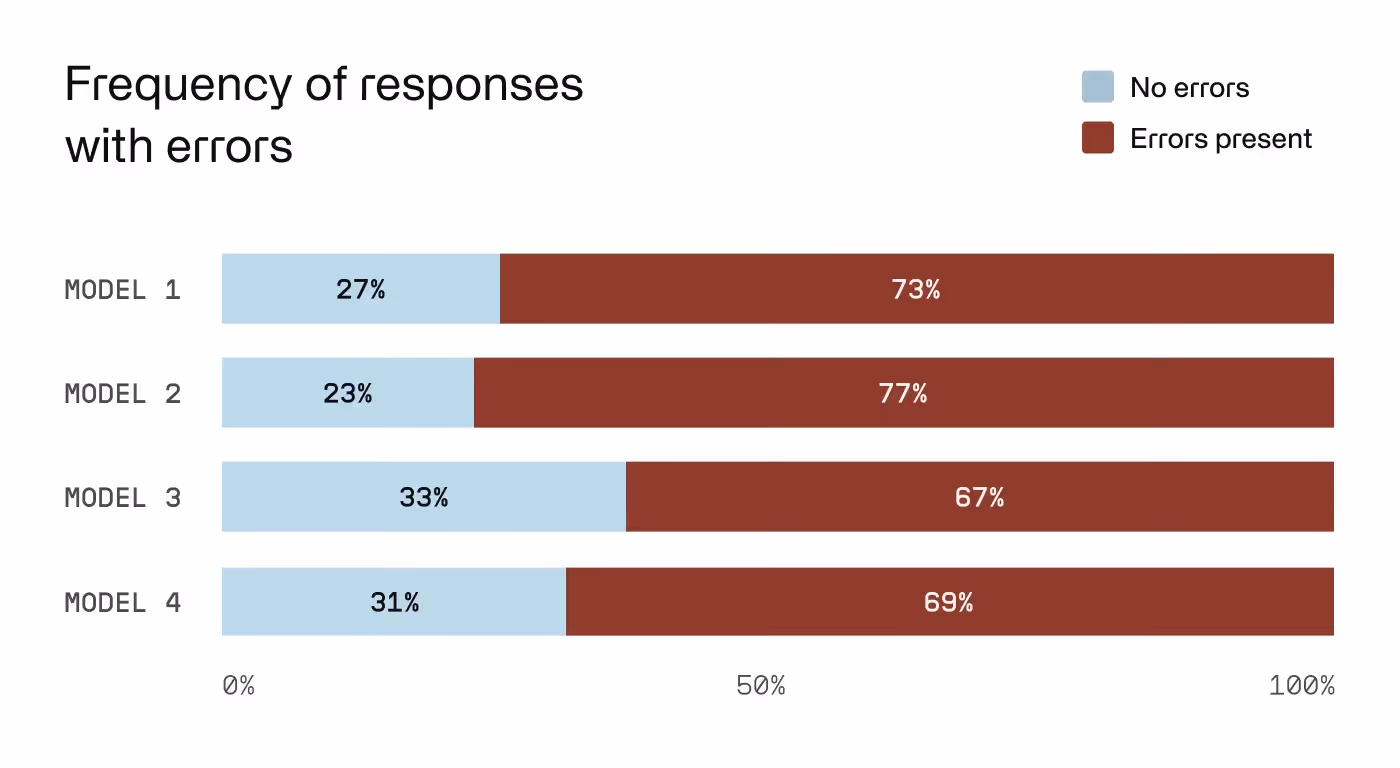
Assessing how frequently AI models return outputs with errors offers a clearer view of model performance. While a high-level summary might show one model as a slight frontrunner, digging into error frequency often tells a different story. In our investor assistant example, Model 2 might have a lower overall error rate, but if those errors involve hallucinations regarding sensitive data or compliance, it is a liability, not an asset.

To build trust with stakeholders, you must categorize these errors:

  • Low-impact errors: Simple grammar or formatting issues that can be fixed with low-effort synthetic data.
  • High-impact errors: Factual inaccuracies, evasive responses, or policy violations that require complex human training data and fine-tuning.

By identifying a pre-trained model that has fewer "prohibitively dangerous" errors (even if its total error count is higher), you can streamline the training process and reach production-level AI performance with 95% less data.

Evaluating foundation AI models by looking at the frequency of errors offers a clearer picture of how they might perform in a chatbot use case, with more significant differences in performance, but doesn’t give information on the type or severity of the errors, which can factor significantly in the chatbot’s performance.

How to evaluate generative AI models to inform training data strategy

Once you have selected a base model and established a performance baseline, the next step is a deep dive into where the model fails to meet business objectives. This isn't just about finding errors; it’s about identifying the specific "failure modes" that inform your training data and fine-tuning strategy.

This stage requires "stress testing"—attempting to "break" the model or induce hallucinations within the context of your specific workflows. You must also validate AI models for safety to ensure you are protecting enterprise data, meeting compliance standards, and adhering to responsible AI policies.

For an investor assistant agentic AI, a technical evaluation roadmap includes:

  • Syntax and prompt robustness: Wording similar requests in various ways to check for inconsistencies in outputs.
  • Adversarial testing: Attempting to induce policy violations, harmful responses, or the disclosure of personally identifiable information (PII).
  • Hallucination analysis: Forcing the model into edge cases to identify why and how factual errors occur.
  • Identity security: Ensuring the model cannot be "tricked" into assuming an identity that grants unauthorized access to sensitive data.
  • Regression analysis: Using metrics like mean squared error (MSE) and mean absolute error (MAE) to check the validity of financial forecasting or numerical outputs.

By performing this surgical gap analysis, ops leaders can develop a precise AI strategy that targets only the necessary improvements. This prevents wasting budget on massive datasets that don't yield a direct business impact.

Table 1
Error type Model 1 Model 2 Model 3 Model 4
Spelling / grammar 7 12 20 6
Factual inaccuracy 9 6 2 9
Compliance 6 7 5 5
Advice without hedge 9 6 2 9
Assumed context 6 4 5 4
Hallucinated source cited 1 1 - 1
Illegal activity - 2 - 1
Inappropriate evasive response - 1 1 1

How a holistic evaluation strategy reduced training data needs by 95%

Implementing a technical validation strategy does more than just build trust with stakeholders. It fundamentally changes the economics of AI adoption. For an ops leader, the most compelling result of rigorous evaluation is the reduction in training data volume, making AI development faster and more cost-effective.

For example, one Invisible client aimed to eliminate a specific class of hallucinations where their LLM produced incorrect or harmful outputs. The initial hypothesis from their internal team was that it would require 100,000 rows of human training data to address the issue.

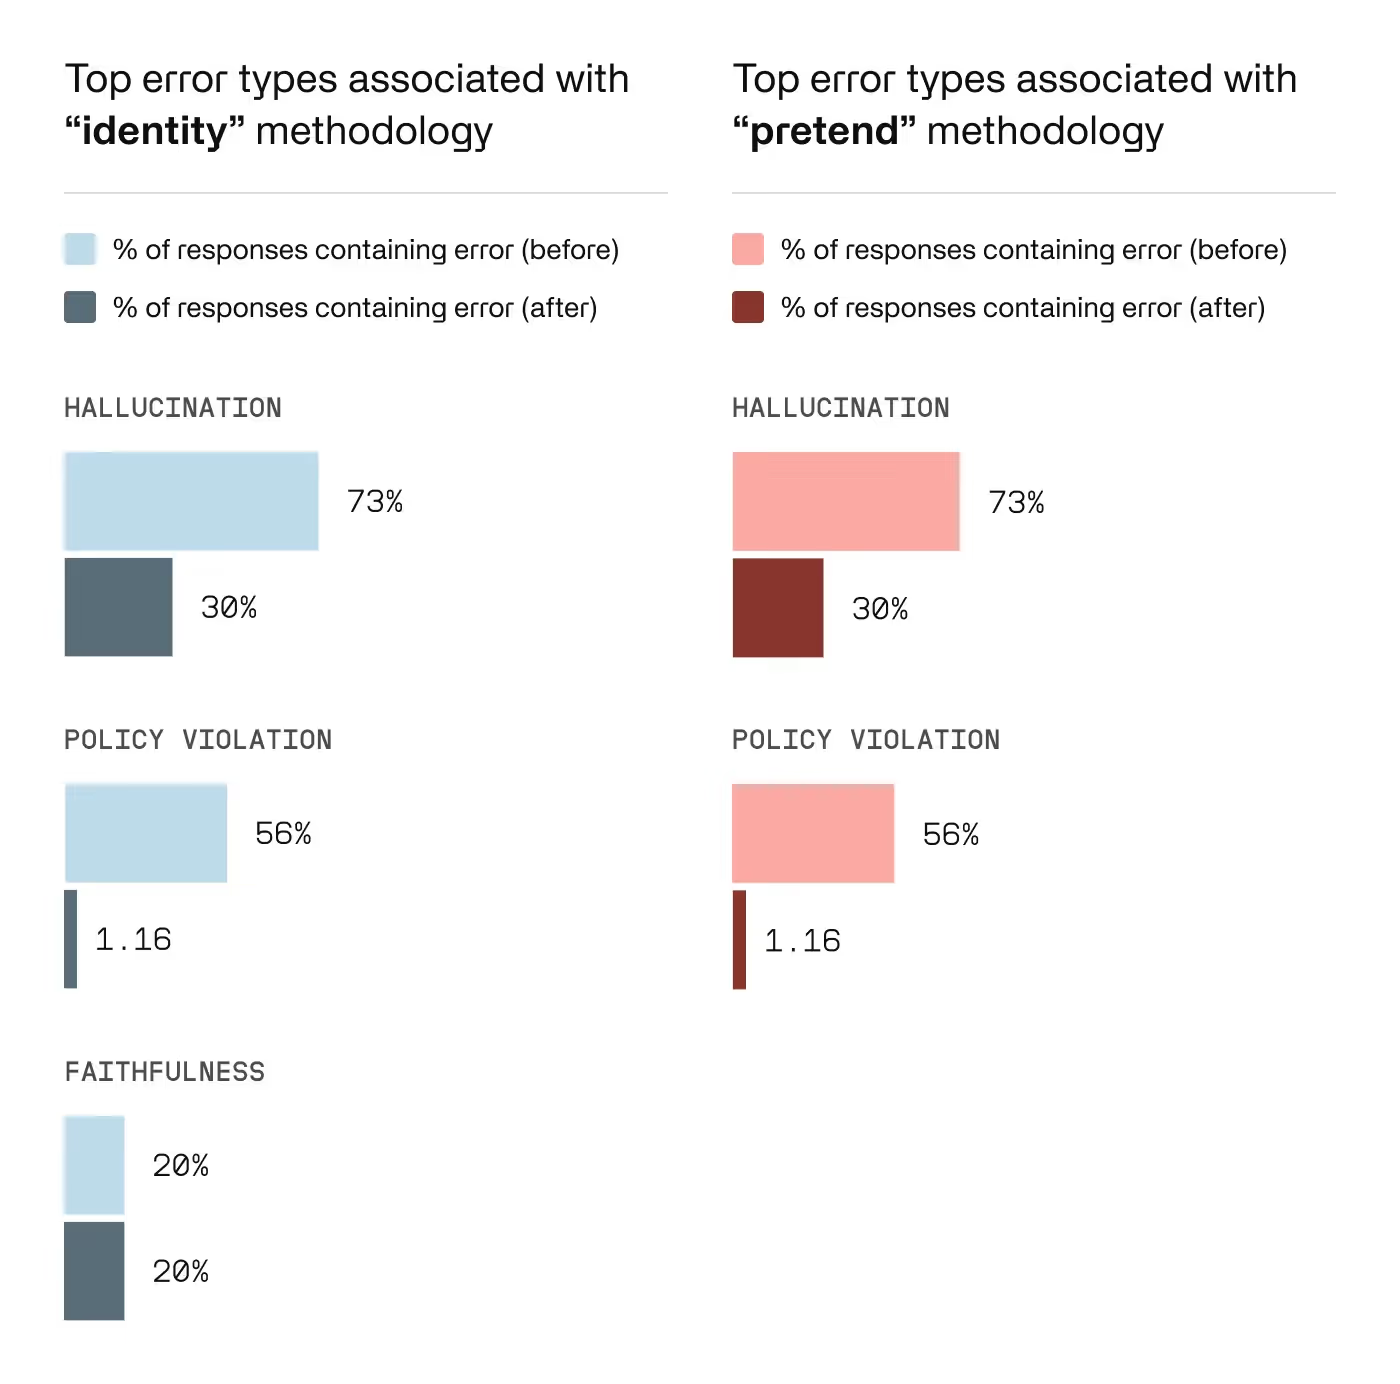
However, Invisible’s end-to-end validation methods revealed a specific "failure mode": the majority of harmful responses occurred only when the model was prompted to assume a specific professional identity or persona.

By identifying this pattern, the Invisible team curated a surgical dataset of only 4,000 rows that paired accurate answers with these specific "identity assumption" prompts. Once ingested via fine-tuning, the model’s frequency of policy-violating responses dropped by 97%. By focusing on the lifecycle of the error rather than the volume of data, the client achieved their business objectives with a 96% reduction in data costs.

Chart displaying error types across methodologies
With human data tailored to address harmful responses to “pretend” and “identity” prompts, Invisible’s team helped this LLM developer reduce harmful responses by 97% — with a 96% reduction in training data.

Get the Invisible difference in your AI model evaluations

Ready to move your AI initiatives from pilot to production? At Invisible, our forward-deployed engineers specialize in the technical overhead of AI deployment. We provide the high-quality benchmarks and continuous monitoring required to ensure your AI agents deliver measurable business value.

Is your AI strategy hitting a wall? Explore our AI training and evaluation services to see how we help enterprise AI leaders scale with precision.

Model evaluation: a glossary

New to AI model evaluation? Here’s a quick glimpse into some of the key terms, evaluation metrics, and methods you’ll come across in your research.

Confusion matrix

A confusion matrix is a sophisticated diagnostic tool in machine learning that provides a granular visualization of a classification model's performance. Think of it as a detailed report card that breaks down how accurately a classifier model predicts different classes. The matrix displays four critical outcomes: true positives (correctly identified positive instances), true negatives (correctly identified negative instances), false positives (negative instances incorrectly labeled as positive), and false negatives (positive instances incorrectly labeled as negative).

For example, in a medical screening model detecting a disease, the confusion matrix would reveal not just overall accuracy, but precisely where the model makes mistakes. Are false negatives (missed diagnoses) more prevalent, or are there many false positives (unnecessary patient anxiety)? This nuanced understanding helps data scientists refine models where precision could literally save lives.

From a confusion matrix, data scientists and machine learning engineers can calculate key classification metrics such as:

  • Accuracy: A basic metric representing the overall correctness of the model’s performance
  • Precision: Measures the exactness of positive model predictions. A high precision metric usually translates to fewer false alarms
  • Recall (sensitivity): Measures the model’s ability to find all positive instances. A high recall score means that the model can catch most positive cases
  • Specificity: Measures the model’s ability to identify true negatives
  • F1 Score: A measurement that combines precision and recall to reflect the model’s performance overall
  • False positive rate: Indicates the proportion of negative instances incorrectly classified as positive
  • False negative rate: Indicates the proportion of positive instances incorrectly classified as negative

Cross-validation

Cross-validation is a statistical technique designed to assess a model's performance by systematically partitioning data into training sets and testing subsets. Imagine dividing a large dataset into multiple smaller segments, like cutting a cake into equal slices. The most common approach, k-fold cross-validation, involves dividing the data into k equally sized segments.

In a 5-fold cross-validation, the model would be trained on 4/5 of the data and tested on the remaining 1/5, repeating this process five times with different training-testing combinations. This approach ensures that every data point gets a chance to be both in the training and testing set, providing a more comprehensive and reliable estimate of the model's predictive capabilities.

Diversity score

The diversity score is a metric designed to evaluate the variability and creativity of content from a generative AI model across multiple generations. It measures how much a generative model can produce unique outputs when given the same or similar prompts, preventing repetitive or overly predictable generations.

Consider this like testing an artist's range: can they create multiple distinct paintings when given a similar starting point? A high diversity score suggests the model can generate varied, creative content, while a low score indicates a tendency to reproduce similar outputs, potentially suggesting limited creative capacity.

Embedding space alignment

The embedding space alignment is an advanced evaluation technique that assesses how well a generative model's outputs align with the semantic representations of input data in a high-dimensional vector space. This method involves comparing the vector representations of generated content with those of reference or training data.

Imagine this as a sophisticated mapping exercise where each piece of text is represented as a point in a complex, multi-dimensional space. Good alignment means generated content clusters near semantically similar reference points, indicating that the model has captured the underlying meaning and context of the training data.

Ground truth

Ground truth represents the absolute, real-world correct answer or authentic reference data against which we compare model predictions. Consider ground truth as the gold standard, the ultimate benchmark of accuracy that serves as the definitive baseline for evaluating model performance. In an image recognition model, ground truth is typically a dataset of images labeled by subject matter experts. In predictive modeling, ground truth represents the actual, observed outcomes, which we can compare to the model’s predictions.

Hallucination rate

The hallucination rate is a critical metric in generative AI model evaluation that measures the frequency of generating false, fabricated, or contextually incorrect information. Unlike traditional model evaluation metrics, hallucination rate specifically addresses the tendency of AI models to produce plausible-sounding but factually incorrect content.

In large language models (LLMs), hallucinations are like creative but unreliable storytellers who mix truth with fiction. A low hallucination rate indicates a model that stays close to factual information, while a high rate suggests the model frequently invents or distorts information. This metric is particularly crucial in domains requiring high factual accuracy, such as scientific research, medical information, or journalistic reporting.

Perplexity

This nuanced statistical measure is used to evaluate language-focused generative AI models, particularly in assessing how well a probabilistic model predicts a sample of text. Think of perplexity as a sophisticated "surprise meter" that quantifies how unexpected or complex a model finds a given sequence of words.

Lower perplexity indicates better model performance, suggesting the model more accurately predicts the next word in a sequence. Imagine a language model as a sophisticated prediction engine: a low perplexity score means it's consistently making educated, precise guesses about upcoming text. In practical terms, this translates to more coherent and contextually appropriate text generation.

Precision

Precision is a critical metric for classifier model evaluation. It measures the exactness of positive predictions by calculating the proportion of correctly identified positive instances among all positive predictions. It answers the question: "When the model predicts a positive result, how often is it actually correct?"

In a spam email detection system, high precision means that when the model flags an email as spam, it's very likely to be spam. A precision of 0.90 indicates that 90% of emails labeled as spam are genuinely unwanted, minimizing the risk of important emails being incorrectly filtered.

Recall (sensitivity)

Recall is a performance metric assessing a classification model's ability to capture all relevant positive instances. It measures the proportion of actual positive cases correctly identified, answering the question: "Of all the positive instances that exist, how many did the model successfully detect?"

Receiver operating characteristic - area under curve (ROC-AUC)

The ROC-AUC is a powerful performance metric that evaluates a classification model's discriminative capabilities by plotting its ability to distinguish between different classes. Imagine a graph that reveals how well a model can separate signals from noise across various classification thresholds.

The ROC curve tracks the trade-off between the true positive rate and the false positive rate. An AUC of 0.5 suggests the model performs no better than random guessing, while an AUC approaching 1.0 indicates exceptional classification performance. For example, in medical diagnostics, a high ROC-AUC might represent a screening test's ability to reliably distinguish between healthy and diseased patients.

Regression analysis

A regression analysis reveals specific strengths and weaknesses in a machine learning model's predictive capabilities. It can also help data scientists better understand feature importance, potential overfitting or underfitting, and relationships between variables (which can be calculated with a linear regression). Some of the key metrics we can calculate from this analysis include:

  • Mean squared error (MSE): The measure of the model's average squared difference between predicted and actual values. A low MSE indicates more precise predictions
  • Root mean squared error (RMSE): The square root of the MSE, which brings the error back to the original data's scale. This measurement is typically easier to understand
  • Mean absolute error (MAE): The MAE calculates the average absolute difference between predicted and actual values. It's less influenced by outliers than the MSE
  • R-squared (Coefficient of determination): This represents the proportion of variance in the dependent variable explained by the model. It ranges from 0 to 1, with 1 indicating a perfect fit

Regression model

A regression model is a predictive mathematical framework designed to estimate continuous numerical outcomes by exploring relationships between variables. Unlike classification models that assign discrete categories, regression models forecast precise numeric values, revealing intricate connections between input features and target variables.

Consider a house price prediction model. A regression model doesn't just categorize houses as "expensive" or "cheap," but predicts a specific price based on features like square footage, location, number of rooms, and local market trends. The model learns complex, non-linear relationships, understanding how multiple interconnected variables influence the final prediction.

Semantic coherence

Semantic coherence is an advanced evaluation method that assesses how well a LLM maintains logical and meaningful connections across generated text. It goes beyond simple grammatical correctness, examining whether the generated content demonstrates a deep understanding of context, maintains a consistent narrative thread, and produces logically connected ideas.

Imagine semantic coherence as a measure of the model's ability to tell a story that makes sense from beginning to end. A high semantic coherence score indicates that the generated text flows naturally, maintains a clear theme, and demonstrates a sophisticated understanding of language and context.

FAQs

No items found.

Invisible solution feature: AI training

Where the world's top AI models are trained

Our platform blends elite global talent with automation to deliver training data at enterprise speed, without compromising research-grade quality.
A screenshot of Invisible's platform demonstrating annotation of a video.