Women's ice hockey has operated with a fraction of the analytics infrastructure available to men's professional hockey, and that gap has directly limited coaching decisions and player development for decades. Since Sportlogiq became the PWHL's official technology supplier in January 2024, the league has had systematic tracking data for the first time in women's professional hockey history. The hockey analytics tools that reshaped the National Hockey League are now being applied to the women's game at scale.
Women's ice hockey ran on box scores for most of its professional history. While the NHL was building out Corsi, Fenwick, expected goals models, and granular shot location data through the 2010s, the women's professional game had no equivalent infrastructure. The NWHL and CWHL operated without league-level tracking systems, which meant hockey coaches made roster decisions from incomplete data and analysts had no way to apply advanced statistics to player evaluation the way the men's game had normalized.
The absence was not from lack of interest. Community analytics projects filled part of the gap, hand-tracking play-by-play data to produce basic scoring chances and possession estimates. Women's college hockey developed more consistent data collection than the professional game in some respects, as NCAA programs invested in data analytics for recruiting and player development decisions. But at the elite professional level, the gap compounded: less data meant less analytical culture, which meant less investment in building the infrastructure to generate more data.
The hockey analytics shift in women's professional hockey is not about adding shots on goal to a box score. It is about applying the full stack of advanced statistics: expected goals, Corsi, Fenwick, SAT (shot attempts total), shot location tracking, zone start breakdowns, PDO. These tools have never been systematically applied to the women's game before.
Expected goals assigns a probability score to each shot based on shot location, shot type, and game state: even strength, power play, or short-handed. That probability, aggregated across a season, gives a more accurate picture of a player's true offensive contribution than scoring chances or plus/minus alone. Corsi and Fenwick measure shot attempt differential at 5v5, capturing possession and territorial control that the final score cannot. Offensive zone starts and zone start percentages show whether a forward's assists and points came from sheltered deployment or production against tough competition.
The fastRhockey R package now publishes PWHL play-by-play data and xG models, making these advanced metrics available to external analysts for the first time. AI-driven shot tracking systems extract shot coordinates and shot types from video at a scale that manual coding never could, attaching defensive pressure context to each event. The hockey analytics pipeline is now running in the women's game.
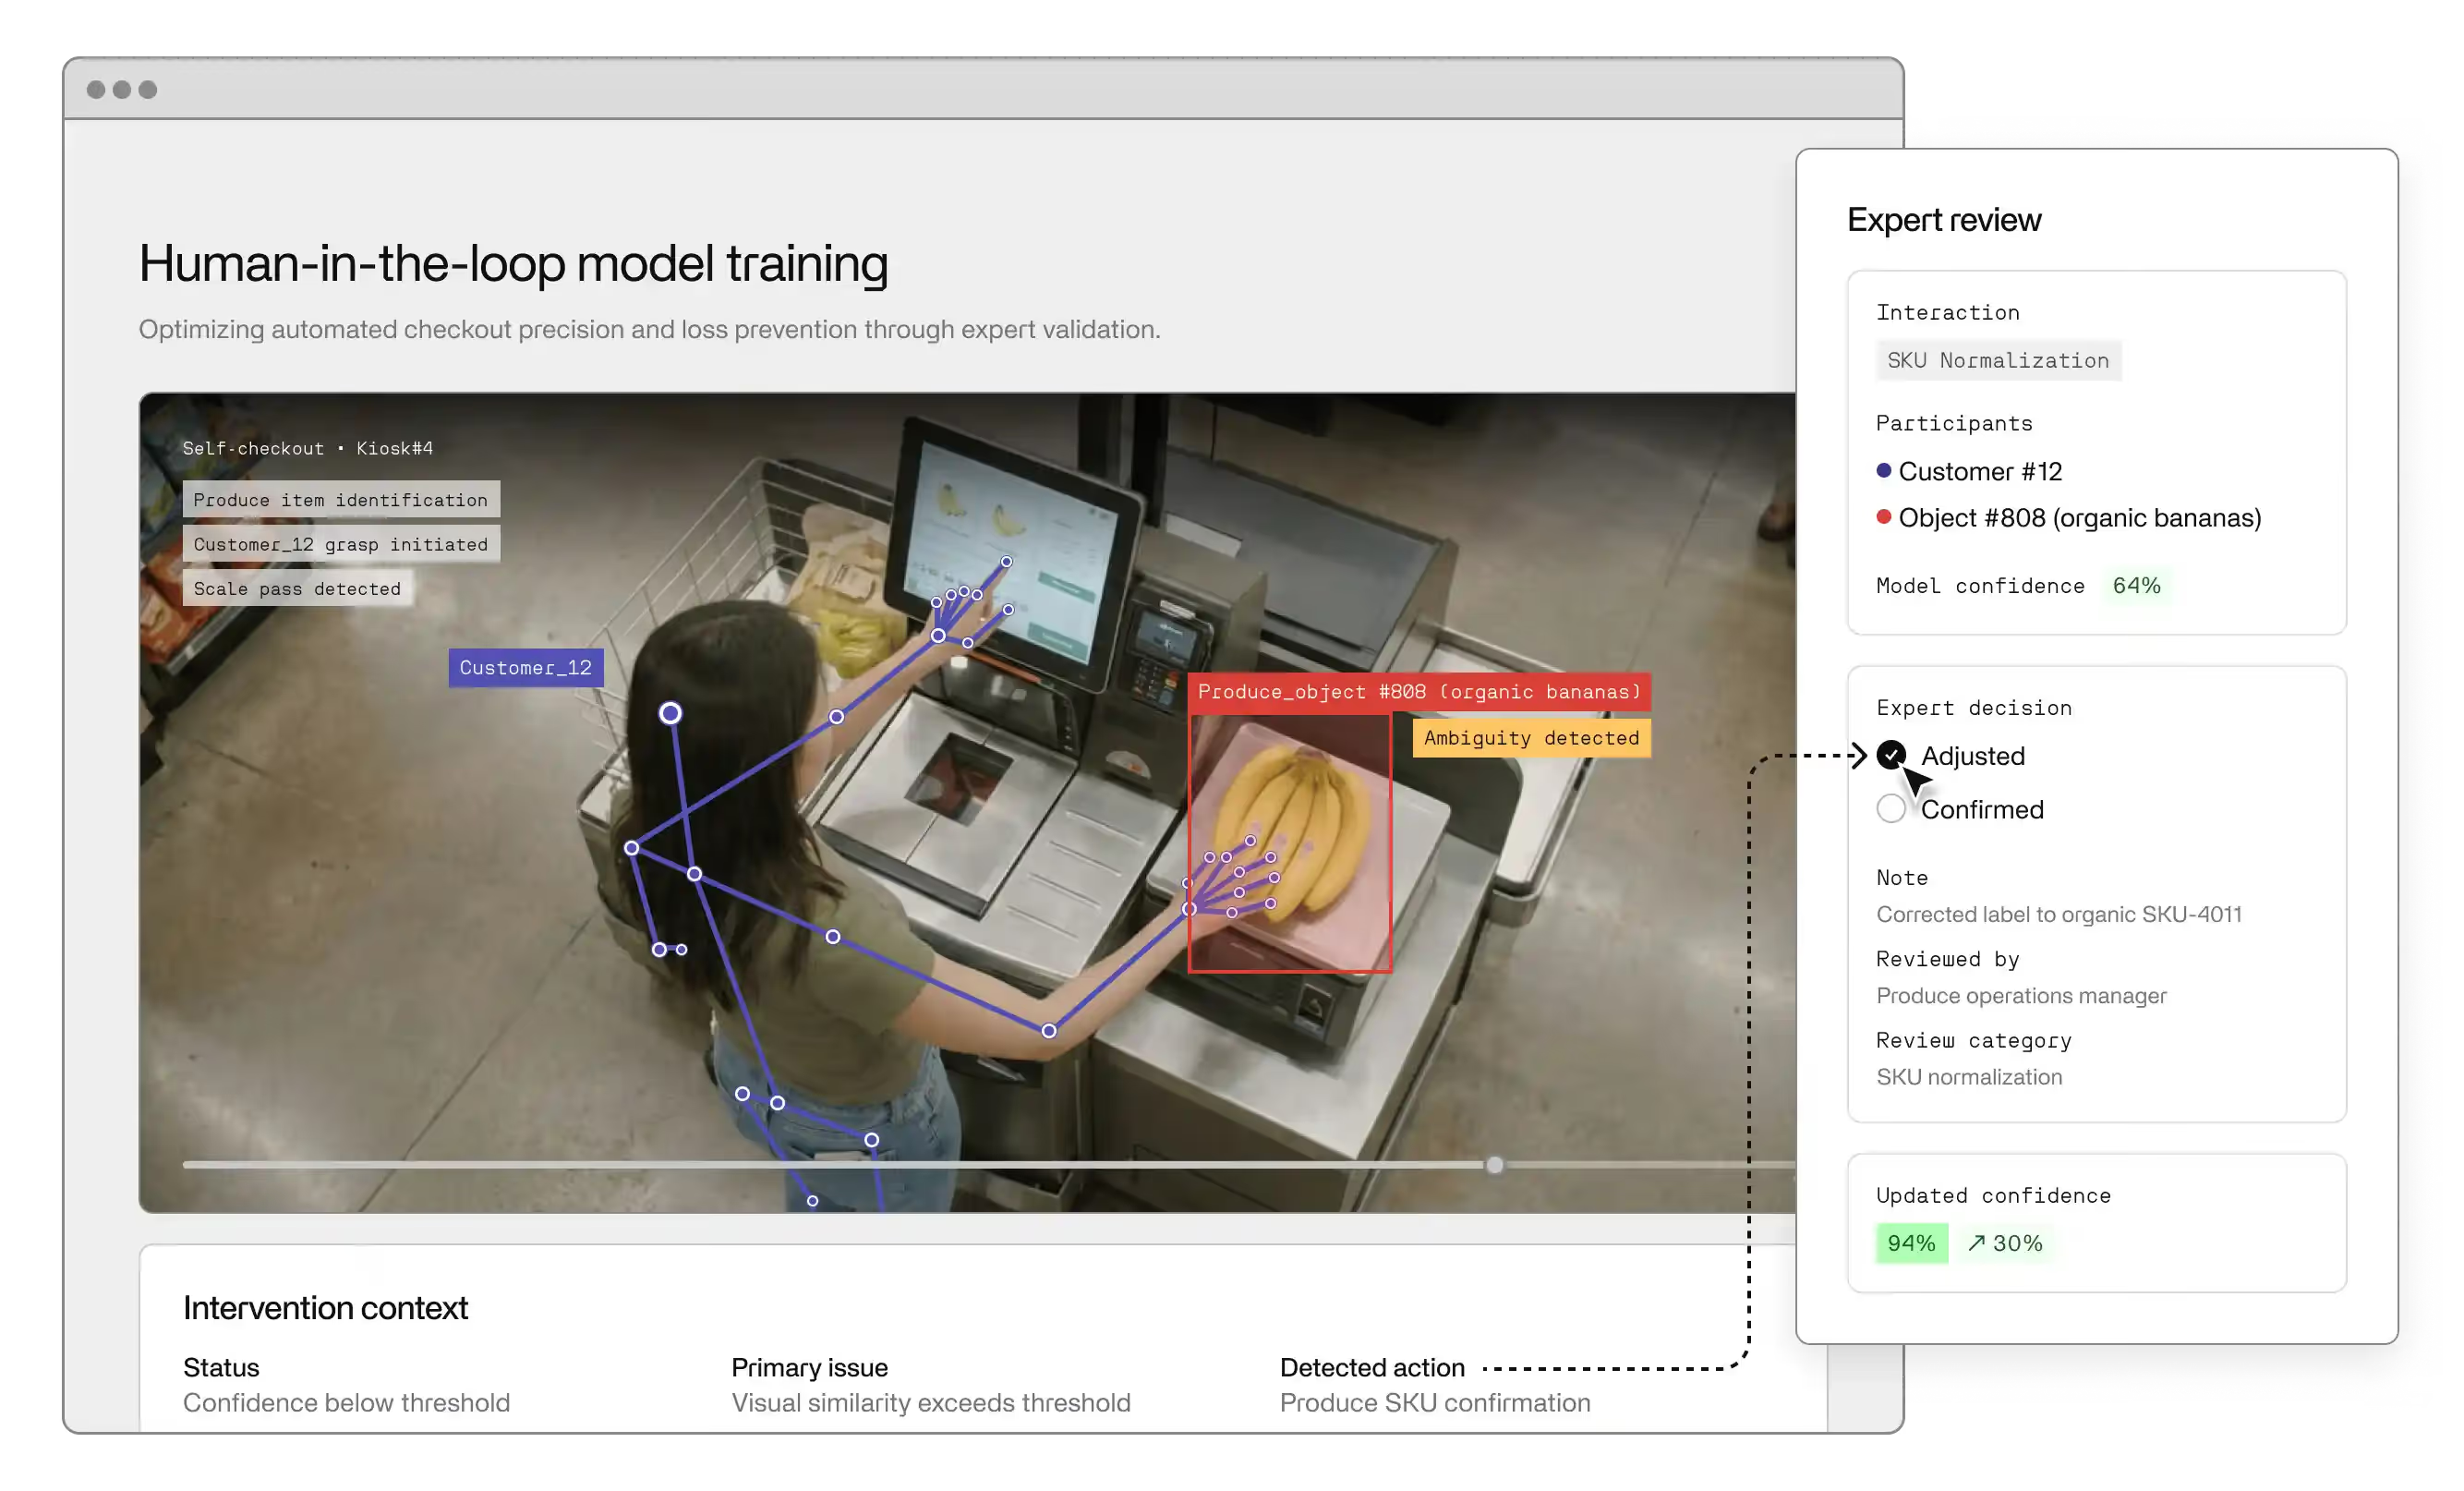
Sportlogiq's appointment as the PWHL's official technology supplier in January 2024 was the most significant shift in women's hockey analytics history. Sportlogiq's computer vision platform tracks every on-ice event. Puck movement, player positioning, shot location, passing sequences — all of it feeds the underlying data that makes advanced metrics possible. The PWHL became the first women's professional hockey league with systematic, league-wide tracking from day one.
The downstream effects have been immediate. The Hockey News used expected goals in its 2026 PWHL Draft analysis, the first time xG had been applied to a women's professional draft class. Abbey Murphy led the 2026 draft class at 0.99 xG per game. Save percentage, now tracked with the granularity available in the National Hockey League, has made goaltender evaluation more precise. Defensive metrics including blocked shots, zone exits, even-strength suppression, and breakout efficiency can be measured consistently for the first time.
The PWHL data infrastructure is generating sport-specific models calibrated to the pace and playing style of elite women's hockey. The data is new. The insights it produces will be too.
The 2025-26 PWHL season produced the first set of records backed by full analytical context. Kelly Pannek finished with 33 points, breaking the league's single-season scoring record, and for the first time that total came with underlying data on shot quality, assists generated, even-strength offensive zone possession, and scoring chances created. Taylor Heise entered the 2026-27 season ranked first in player evaluation models that incorporate possession data alongside traditional box score production.
Aerin Frankel's season illustrated why save percentage alone undersells elite goaltending. Her eight shutouts made her the first goalie named PWHL MVP, but the more precise story is in the shots on goal she faced, where those shots originated on the ice, the shot quality attached to each, and the expected-goals value she stopped. Statistical analysis of save performance against expected goals saved tells a different story than raw save percentage when shot quality varies significantly by opponent.
Haley Winn led the league with 26:45 average ice time per game, including full breakdowns by strength state. That figure means something different when broken down by zone start and Corsi differential at each strength state, turning raw ice time into a picture of deployment strategy and two-way contribution. Hockey coaches now have the defensive context to evaluate and explain ice time allocation in ways box scores could never support.
For Marie-Philip Poulin, who missed most of the 2025-26 season with a knee injury, the analytics era creates a different kind of clarity: the ability to model shooting percentage and offensive zone impact over time, isolating shot generation from raw point totals, showing precisely what an elite player's absence costs across every game state. For Sarah Nurse and Hilary Knight, veterans building careers in the PWHL era, that same infrastructure is reframing how their value gets quantified and communicated to coaches, broadcast partners, commercial sponsors, and the sport's growing institutional base.
Hockey coaches in the women's game are using data analytics for in-game adjustments and roster construction in ways that were not possible two seasons ago. Matchup planning against opponents' power play units now draws on opponent Corsi data and zone entry rates. Line combination decisions can incorporate expected goals differential rather than point totals alone. Coaches who built careers in box-score environments are now operating with the same analytical toolkit their counterparts in the National Hockey League have had for a decade.
Player development decisions are changing too. College hockey programs that feed into the PWHL can now calibrate development work against the analytics benchmarks used at the professional level. A forward who posts strong expected goals numbers at even strength in the NCAA can be evaluated against xG models calibrated to the PWHL, giving development staff a more granular view of what the transition to professional play requires. The data pipeline between college hockey and women's elite hockey is becoming more coherent.
Advanced metrics are reshaping broadcast commentary too. Analysts and broadcasters now work from the same infrastructure coaches use for in-game decisions, giving fans richer context for what they're watching. That visibility builds the analytical culture that sustains the next round of investment in tracking infrastructure.
The data gap in women's ice hockey was never a technical problem. It was a resource allocation problem: without data infrastructure, there is no analytical culture; without analytical culture, there is no demonstrated ROI from investment; without demonstrated ROI, the infrastructure does not get built. The PWHL breaking that cycle matters beyond hockey.
Women's sports analytics is growing because leagues and teams recognize that AI-powered data collection and modeling tools that transformed men's professional sports scale equally well to women's competitions. The sports analytics industry did not need to invent new methods to apply to women's hockey. It needed to apply existing ones to a new dataset. The models work. The data infrastructure exists. What was missing was the organizational decision to build it.
Data equity in sports means the analytical tools that inform coaching decisions and player development are available at equivalent quality across competitions. The PWHL is closing that gap in women's ice hockey faster than any previous professional league has, and the first two seasons of data are already showing what becomes possible when the infrastructure exists.
If your organization is building data infrastructure to turn raw tracking data into operational decisions, in sports or any environment where AI needs to extract signal from complex event streams, explore how Invisible Technologies supports sports analytics or get started.
The PWHL uses Sportlogiq's computer vision tracking platform, which generates play-by-play positional data for every on-ice event. The fastRhockey R package makes PWHL xG and play-by-play data available to external analysts. Advanced statistics including expected goals, Corsi, Fenwick, save percentage, and zone start data are now tracked systematically across PWHL seasons.
Women's hockey analytics is roughly a decade behind the National Hockey League in institutional maturity but accelerating fast. The NHL began systematic advanced statistics tracking in the early 2010s; the PWHL gained equivalent infrastructure in 2024. The models and methods are the same; the dataset is newer and growing with each season.
Expected goals assigns each shot a probability of scoring based on shot location, shot type, game state, and situational context, including rush shots, rebounds, even-strength plays, and secondary chance opportunities. That probability total over a season reflects the quality of a player's scoring chances, not just the quantity. The 2026 PWHL Draft was the first women's professional draft to use xG in scouting analysis.
The data gap reflected a resource allocation problem rather than a technical one. Building tracking infrastructure that makes advanced statistics possible requires capital investment and league-level organizational support. The NWHL and CWHL operated without those systems. Community analytics projects filled some of the gap but could not generate the sensor-based tracking metrics that underpin hockey analytics at the NHL level.
Coaches use analytics for line matching and deployment planning, as well as real-time in-game adjustments. Even-strength Corsi differential and expected goals against help hockey coaches evaluate whether players are outperforming their underlying numbers; zone start data confirms whether those results came from sheltered or competitive deployment. Player evaluation models that combine possession data with traditional scoring inform roster construction.
Cross-level comparison requires calibration because competition level and pace differ significantly between women's college hockey and the PWHL. As xG models and play-by-play tracking become consistent in both environments, that comparison is improving. The 2026 PWHL Draft used expected goals to assess NCAA players, making the cross-level analytical comparison explicit for the first time.