The 2026-27 NHL season opens with something qualitatively different on every bench: AI systems that do not just track what happened on the ice but predict what should happen next. Hockey analytics has moved beyond Corsi and Fenwick possession counts into real-time expected goals models, computer vision-based zone tracking, and AI-assisted line combination optimization. The teams that built the data pipelines to ingest and act on this intelligence over the summer now carry a competitive edge that will not show up in the standings for weeks — but will shape every game they play.
Hockey analytics evolved from basic possession metrics into AI-driven predictive systems that can tell you not just who had the puck last shift, but which line combinations are statistically most likely to generate high-danger scoring chances against a specific opponent.
The national hockey league has tracked hockey statistics for generations. Shots on goal, assists, save percentage, and penalty kill efficiency were box score staples long before analytics became the word for it. What changed was the interpretation layer. Corsi, which counts all shot attempts for and against, and Fenwick, which excludes blocked shots, gave analysts a reliable proxy for puck possession before systematic player tracking existed. PDO, the sum of a team’s on-ice shooting percentage and goaltender save percentage, emerged as a regression signal: teams running unusually high PDO numbers were performing above sustainable levels, and those running low were due for correction.
Expected goals models went further. Rather than counting shot attempts equally, xG models weight each attempt by quality: shot location, angle, traffic, screen presence, and whether the attempt followed a rebound. A slot shot after a clean zone entry generates more expected goals than a shot from behind the net against a set defense. That distinction matters because a team can lead in Corsi and still lose badly if the shot quality distribution is inverted.
Machine learning moved the ceiling again. Where a regression model tells you the historical xG value of a shot type, an ML model trained on millions of NHL sequences can detect patterns in zone entry routes, line-change timings, and defensive zone coverage assignments that precede high-danger opportunities against a specific opponent. That is the analytical leap that Corsi and Fenwick could not make: from description to prediction.
The practical result is a different definition of what AI sports performance analytics means for an NHL front office. The baseline is no longer descriptive hockey statistics but ML-driven prediction, and the operational question is whether a team’s data infrastructure can deliver that intelligence at a speed coaching staffs can actually use.
AI systems in the NHL now process data from tracking cameras, wearables, and video feeds simultaneously, producing live xG models, zone entry logs, and player load metrics that coaching staffs can act on between periods and, increasingly, during games.
The puck-and-player tracking system deployed league-wide captures position data at 60 frames per second from cameras embedded throughout arenas. That data volume was never manageable through manual analysis, which is why hockey analytics programs now run purpose-built AI pipelines rather than analyst-driven spreadsheets.
On the offensive side, zone entry classification drives the most consequential coaching decisions. Platforms using AI-powered computer vision to process hockey footage automatically classify every zone entry: controlled carry-ins, dump-and-chase plays, and failed entry attempts, along with the players involved, defensive responsibility, and what happened in the ten seconds that followed. Sportlogiq has built that granularity into its platform, replacing manual video review that once took analysts hours per game.
Shot attempt heat maps reveal where a team generates and concedes shots, surfacing offensive zone coverage breakdowns that box scores never captured. PDO correction separates sustainable defensive performances from those inflated by goaltender hot streaks. AI models now assess each save opportunity by quality-adjusted difficulty, giving coaching staffs a clearer view of goaltender performance that isolates execution from shot quality faced.
Defensively, the same systems produce a per-shift record for every defensive pair: where zone starts fall, how coverage holds when forechecking pressure builds, and which shots reach the goaltender. The data that once took days of video review to compile now lands in coaching dashboards before morning skate.
Teams using AI-driven hockey analytics most effectively are compressing the gap between observation and action, turning what used to be a post-game scouting report into a real-time decision input.
WAR (Wins Above Replacement), adapted from baseball for hockey’s multi-position complexity, gives front offices a defensible basis for player evaluation that goes beyond traditional hockey statistics. A defenseman with a modest assist total but a consistently positive impact on shot differential, zone entry suppression, and defensive zone exits carries a different WAR value than one whose counting stats look similar but who benefits from favorable zone starts and weak competition. Teams that have built advanced analytics infrastructure are evaluating players at a level of granularity that intuition-backed scouting cannot match on its own.
The build-vs-buy decision is real for organizations without existing data operations. Teams evaluating whether to build or acquire sports analytics software capabilities are working through the same tradeoff the baseball and basketball analytics communities confronted a decade earlier: platform solutions offer faster deployment but limit differentiation; in-house builds produce proprietary models but require data science talent that competes with other NHL organizations.
In-game decisions are moving in the same direction. Power play deployment is increasingly informed by real-time opponent penalty kill tendencies: which side of the ice the opposing PK overloads, which shooters carry the highest xG rates from specific zones, and which power play formations have been most effective against this specific goaltender. Penalty kill units get the corresponding analysis from the other direction.
WAR also changes trade valuation. A player with strong underlying data but soft counting stats is easier to identify and easier to acquire at a discount if your analytics infrastructure can quantify the gap between what a player contributes and what gets recorded. The AHL pipeline is getting the same treatment: teams running the same tracking infrastructure for their affiliates as for NHL rosters get continuous development data from the moment a prospect enters the professional system, giving player evaluation models years of context before a player sees NHL ice.
Building capable AI models for hockey is the easier half of the problem. Running the data operations that keep those models accurate, current, and actionable at the speed teams need is where most sports analytics programs break down.
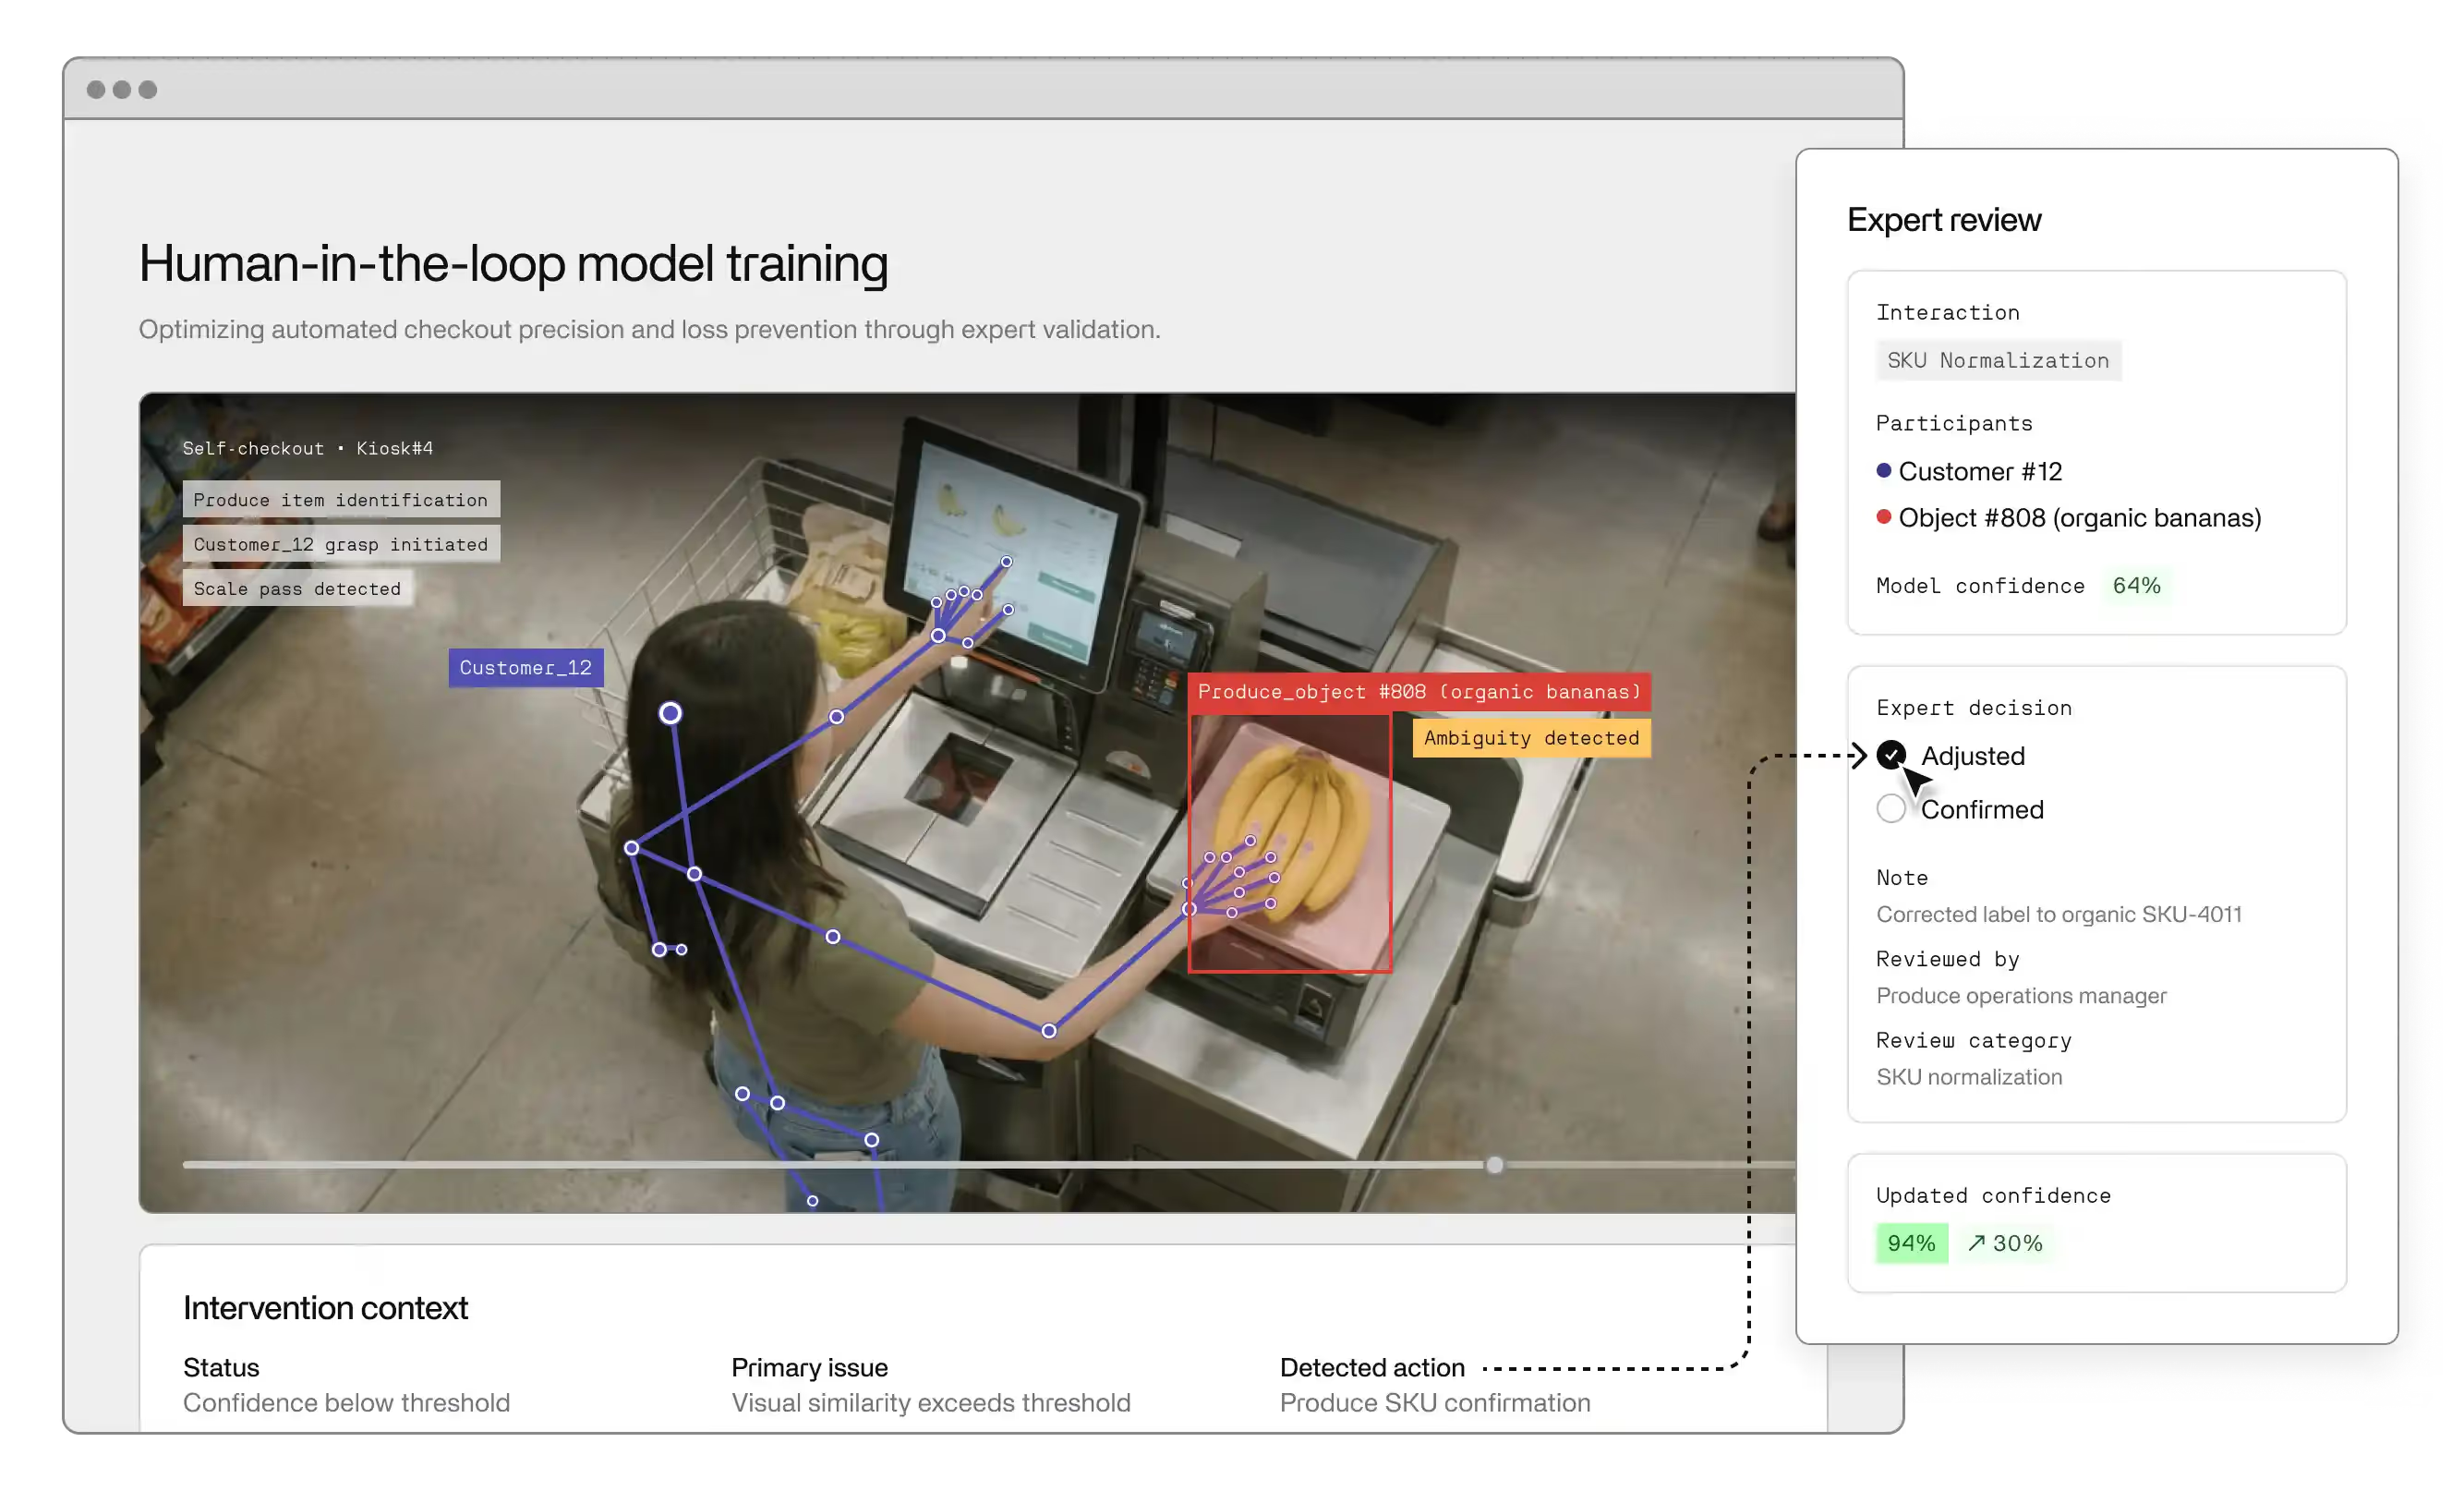
Every AI model in a sports context depends on the quality and consistency of its training data. Computer vision systems that classify zone entries need human review when model confidence is low: an ambiguous camera angle, a replay sequence that disrupts tracking continuity, or an unusual defensive formation that falls outside the model’s training distribution. Without a structured human-in-the-loop review layer, those edge cases either corrupt model outputs or disappear from the dataset entirely.
Invisible builds and operates the AI workflow infrastructure that keeps sports analytics pipelines reliable at scale. For organizations running predictive player modeling, biometrics tracking, or AI play-call suggestion systems, Invisible’s sports team handles the operational layer: structuring incoming tracking data, running quality review on model outputs, flagging low-confidence classifications for human judgment, and cycling findings back into coaching workflows fast enough to matter.
The hockey analytics programs that have built durable competitive advantages treated data quality as an ongoing operational function, not a one-time data science project. The teams that have not are running analytics on degraded data they cannot identify as degraded because there is no review process in place to surface it.
The organizations that treat data science as infrastructure are already pulling ahead of the ones that treat it as a department, and that gap will widen every season. Baseball’s Moneyball era showed what happens when systematic, data-backed evaluation displaces gut-feel roster decisions across a league. Hockey’s version of that shift is arriving now, accelerated by the maturation of computer vision tracking and real-time biometric systems that baseball never had to contend with.
Three changes are already in motion. First, xg models are being retrained on larger datasets with more granular positional inputs, narrowing the confidence intervals that have historically limited how much front offices trust individual-game outputs. Second, real-time heat maps and shot attempt visualization are moving from post-game review tools to in-game decision support, giving bench coaches better information about where sustained offensive zone pressure is breaking down during a period. Third, the AHL is becoming a data laboratory. Organizations that instrument their development pipelines at the minor league level are building predictive models on prospect trajectories that no traditional scouting report can produce.
Sportlogiq and similar computer vision providers have made tracking data broadly accessible across the NHL, which means the competitive moat from having data is closing. The moat that is opening is operational: which organizations can build the pipelines to move raw tracking output through quality review, structure it consistently, and deliver it to coaching staffs as intelligence they will actually use. Save percentage, penalty kill efficiency, and defensive-zone shot suppression have been measurable for years. Acting on that information at the speed the regular season demands is the capability that separates programs now.
The organizations waiting for the technology to mature before committing to an analytics infrastructure are making the same bet most front offices made in 2003. Most of those teams spent a decade catching up.
The teams winning the analytics race in professional hockey right now are not the ones with the most sophisticated models. They are the ones that have invested in the operational infrastructure to make those models reliable enough to act on. Data quality review, human-in-the-loop classification, and structured pipelines from tracking system to coaching staff are the work that makes the AI valuable. Building that infrastructure is not a data science problem. It is an operations problem.
Invisible builds and manages the AI operations layer that professional sports organizations rely on for scalable, reliable analytics. Talk to our team to see what that looks like in practice.
Corsi counts all shot attempts from a team or player, regardless of quality. Expected goals weight each attempt by the probability it results in a goal, based on factors like shot location, type, and game state. Corsi is better for measuring zone possession and pressure; expected goals are better for evaluating whether a team’s scoring chances are genuinely dangerous.
AI-powered systems let teams evaluate goaltenders against xg models rather than raw save percentage, which does not account for shot quality faced. A goaltender with an average save percentage but consistently high goals saved above expected is outperforming the number. This distinction matters most in trade valuation and contract negotiations.
PDO is shooting percentage plus save percentage for a team over a defined period. It is among the most useful hockey statistics for identifying regression candidates, because both figures revert toward league average over time. A PDO significantly above or below 1.000 is typically a luck indicator. Analysts use it to discount outlier performance before the trade deadline.
AI play-call systems give coaching staffs real-time probability estimates for specific zone entry routes, shot attempt sequences, and defensive zone coverage schemes during special teams play. Teams use heat maps of historical scoring chances and rebound opportunities to calibrate where power play shots are generated versus where they convert, and adjust positioning accordingly.
Zone entry data separates how teams get into the offensive zone: carrying the puck versus dumping it in and chasing. Controlled zone entries, particularly below the dots and behind the net, generate significantly more scoring chances and shot attempts than dump-ins. Coaching staffs use this data to design line-specific entry strategies and identify which opponents are vulnerable to aggressive entries.
Most teams can get basic tracking data analysis running within a season, but building the full infrastructure: quality-reviewed model outputs, structured pipelines, and consistent data feeding player evaluation decisions, typically takes two to three years. The technical build is faster than organizational adoption, which requires front office and coaching staff buy-in to sustain.