Computer vision produces structured metadata—digital shorthand for what is happening in a video—rather than just heavy video files. This information includes labels that identify specific objects, location coordinates that pin them to a coordinate grid, and confidence scores that tell you how sure the system is about what it sees. Enterprise operations use this structured output to automate workflows by connecting visual events directly to systems like an ERP, WMS, or CRM. This allows for real-time alerts for safety issues, instant inventory management, and the ability to spot operational bottlenecks using movement heat maps. By turning raw pixels into searchable digital facts, computer vision allows companies to treat physical movements as data points to drive a clear ROI.
Your operation is currently leaking information that your existing tech stack simply cannot see. While your warehouse or factory cameras record thousands of hours of footage, that video remains a dark asset because it lacks searchable structure.
This article explores the specific data outputs of AI models and the practical steps required to integrate computer vision technology into your real-world operations.
For a broader look at how these systems fit into your overall technical strategy, see our comprehensive guide to computer vision for enterprise leaders.
Instead of streaming and saving every pixel, a process that consumes massive bandwidth and local storage, modern computer vision algorithms process the frame at the source and transmit only the essential facts. This converts a heavy media file into a lightweight JSON text packet that describes the scene with mathematical precision. This packet includes specific object IDs, timestamps, and spatial coordinates, allowing you to treat visual inputs as a high-velocity event stream.
This architectural shift enables you to monitor thousands of feeds across global sites without upgrading your network infrastructure. By stripping away the pixels at the edge, the system only sends the intelligence back to your central systems. For instance, if a pallet moves from a loading dock to a rack, your server receives a text string confirming the transfer rather than a 10-second video clip.
This makes visual information as lightweight and queryable as a barcode scan or OCR data, allowing you to run complex analytics on physical behavior across multiple facilities simultaneously.
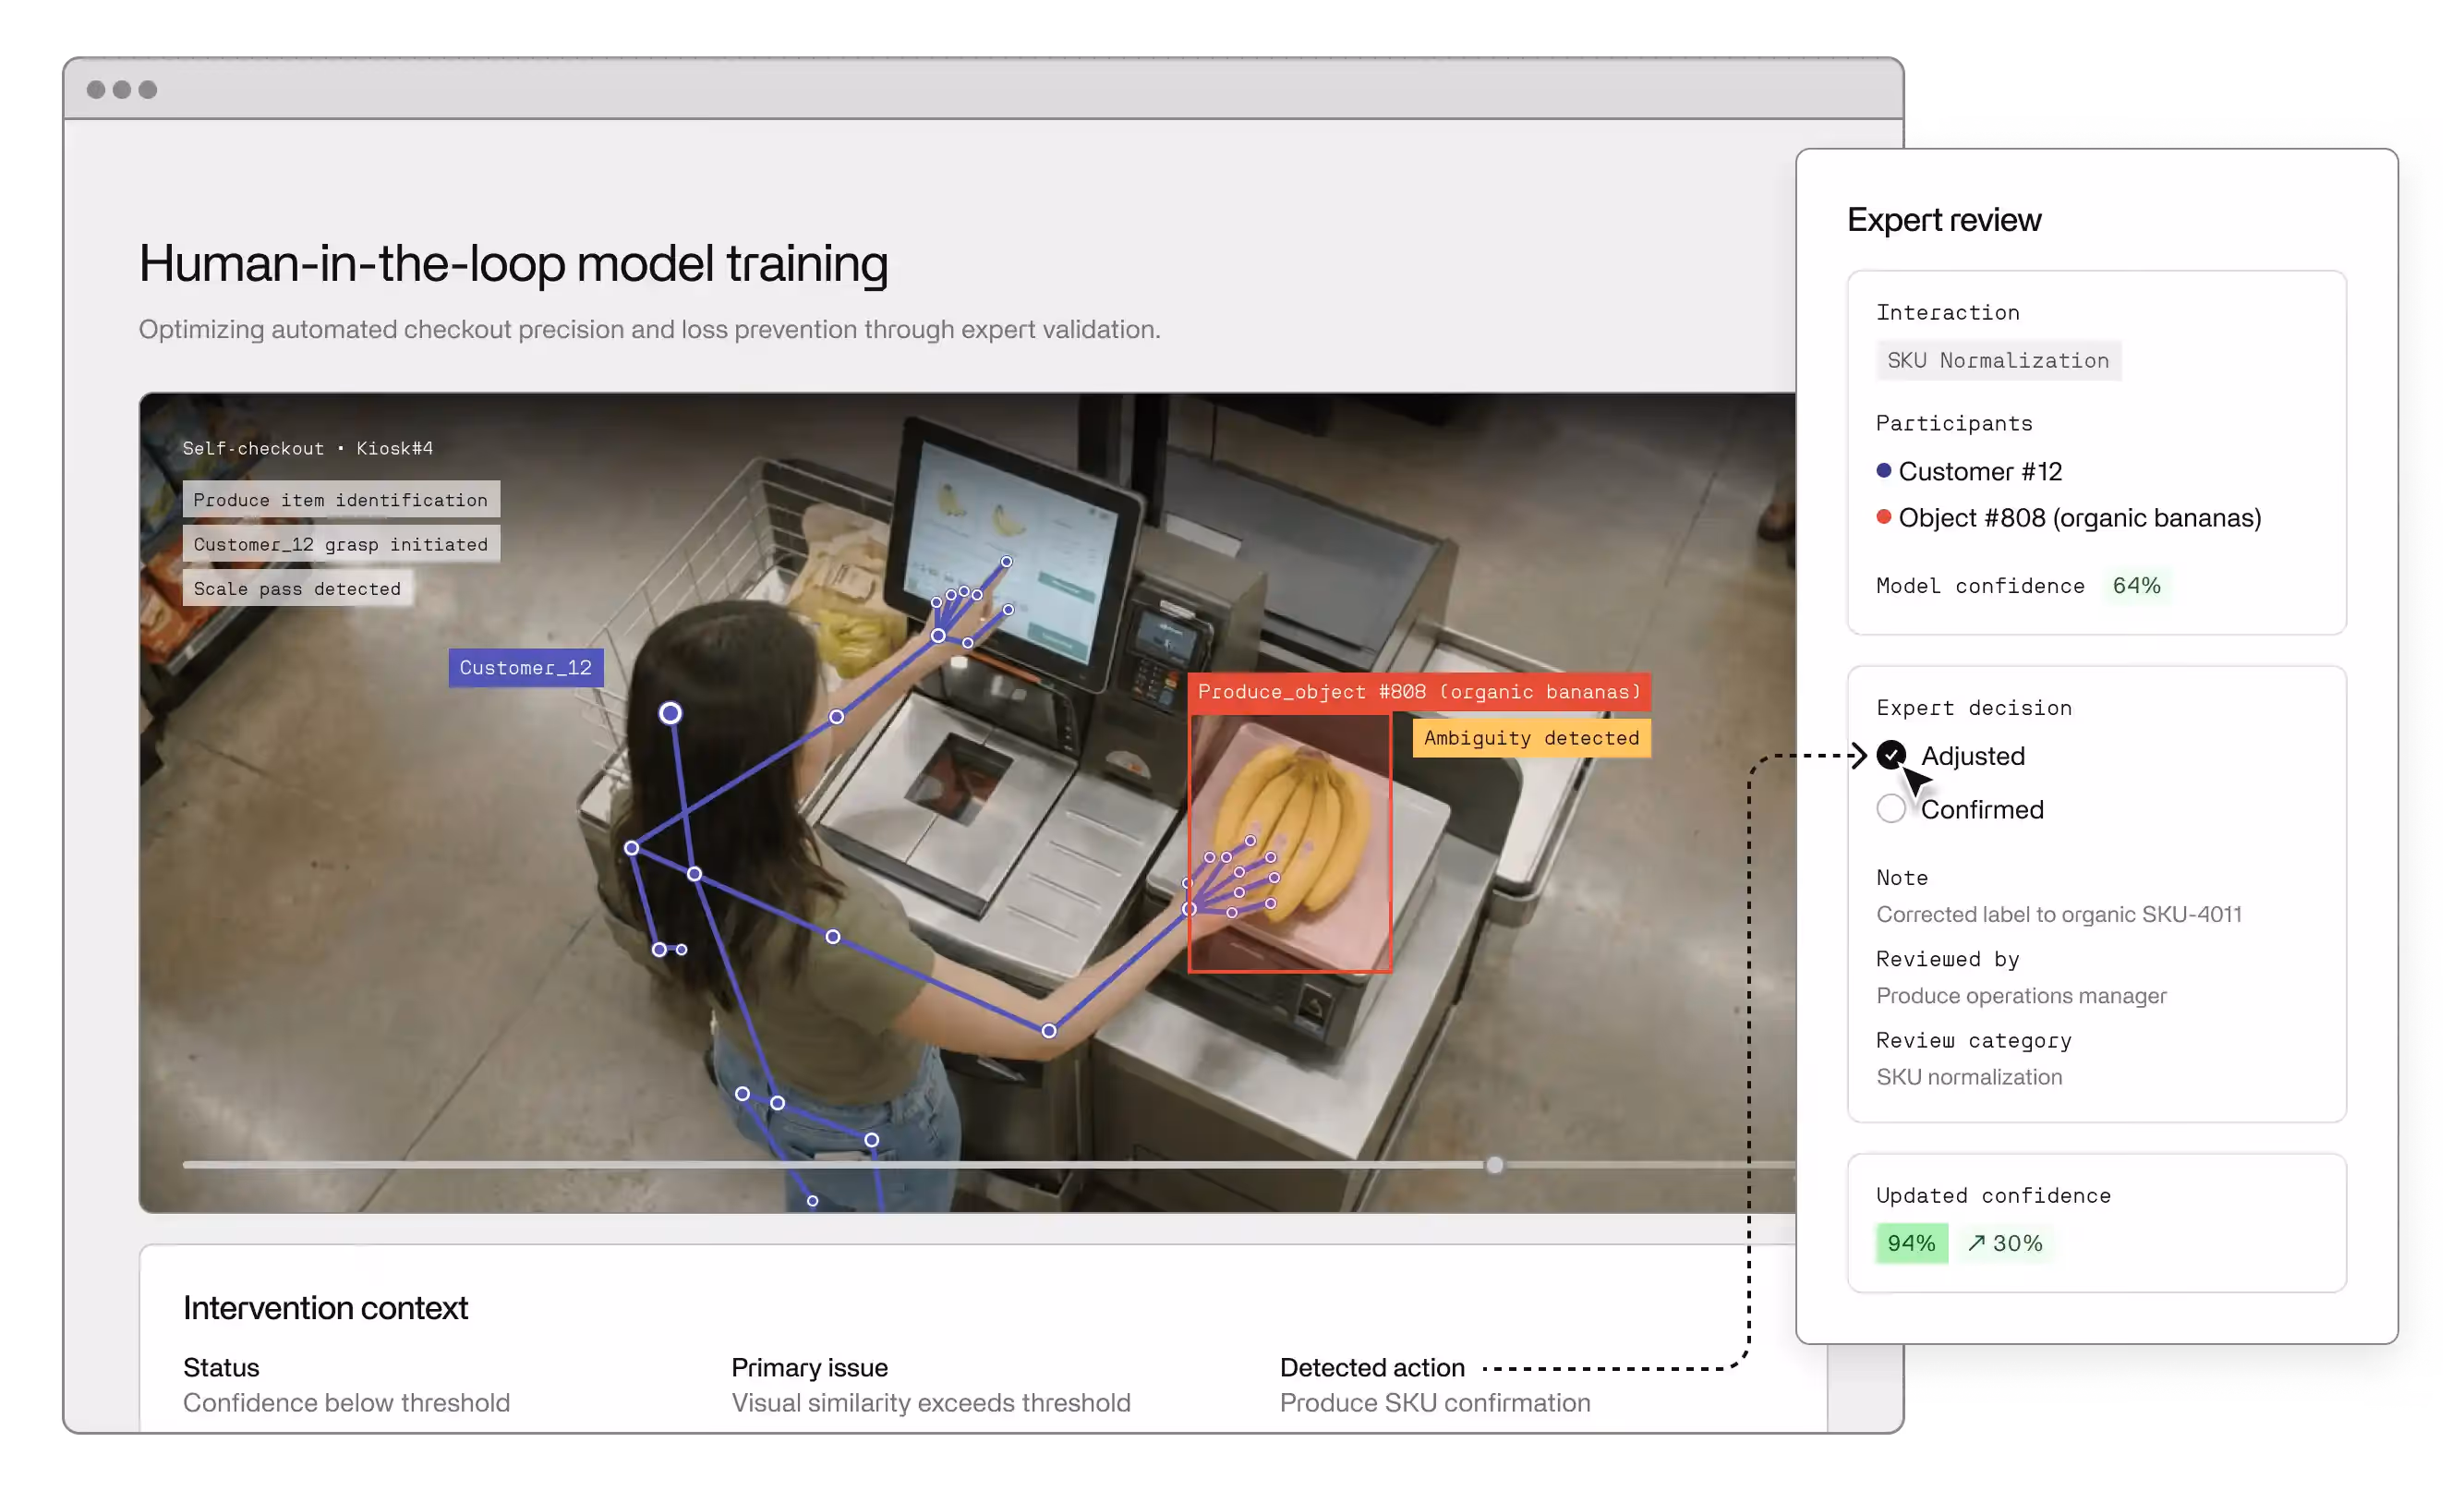
To understand how these events function in a production environment, consider how raw visual detections translate into the specific business outcomes that drive your core KPIs:
The data your system produces is only as reliable as the training data used to teach the model. While human vision can intuitively adjust for poor lighting or skewed camera angles, AI models require thousands of high-quality examples to achieve the same accuracy. These labeled images, or annotations, serve as the ground truth. They tell the algorithm exactly which pixels represent a defect and which are just a shadow.
Modern systems often rely on CNNs (Convolutional Neural Networks) to process these details. CNNs excel at recognizing patterns across layers, making them the standard for enterprise-grade detection. However, for an operation at scale, you cannot rely on generic models; you must use datasets that reflect your specific environment.
This is where the distinction between image classification and image segmentation becomes operationally critical:
This granular level of detail produces a much richer data stream, allowing you to calculate near-miss safety metrics that traditional sensors would ignore. By investing in rigorous training data upfront, you ensure the structured output of your computer vision systems is accurate enough to trigger automated actions without the risk of false alarms.
Every operation has a formal manual, and every operation has the actual way work gets done. Various applications of computer vision produce movement and timing data that expose the gap between these two realities. When you analyze the spatial movement of technicians on a manufacturing floor or warehouse operatives across a fulfilment site, the data often reveals that employees have invented their own workarounds to compensate for broken software or poor equipment layouts.
By converting these paths into heatmaps through object tracking, you gain a dataset that measures the cost of these inefficiencies. If the data shows that 40% of an employee's time is spent walking between stations to find a single tool, you have identified a UI/UX bottleneck that a standard log would never surface. This insight allows you to optimize and streamline your workflows based on how work is actually performed, rather than how the manual says it should be.
In retail and logistics, visual information provides a window into customer behavior that exceeds the capabilities of a standard point-of-sale system. While your register tells you what was bought, computer vision tells you what was considered and then put back. By tracking a customer’s journey from the entrance to the checkout, the system generates data on dwell times at specific displays.
The output of these deep learning models can also help optimize the most critical part of the journey: the checkout line. Vision data identifies when a queue is too long or when a customer looks confused. This produces a time-to-help metric that helps managers allocate staff dynamically. Instead of relying on a human supervisor to spot a bottleneck, the vision system produces a data trigger that alerts a staff member, ensuring your capacity always matches real-time demand.
The primary reason computer vision tasks stall in the pilot phase is that the data stays stuck in a separate dashboard instead of going where decisions are made. To make this data useful, you must build a translation layer that maps visual events to your business logic. If a model identifies a spill on a floor via object detection, that detection is useless if it only exists as a red box on a screen. It must be translated into a service ticket in your facilities software and pushed to a janitorial staff member’s smartphone via internal apps.
This layer functions as an API bridge. It takes a raw event, like a specific part appearing on a conveyor, and cross-references it with your ERP system to verify if that part was expected.
Senior leaders often hesitate to deploy vision systems because of the perceived risk to privacy. However, the data produced by enterprise-grade machine learning can be fully de-identified the moment it is created. By using edge processing to detect human movement as anonymized skeletons or heatmaps, you can extract 100% of the operational value without ever using facial recognition to capture or store faces.
When you treat privacy as a technical specification, you remove the barrier to adoption. You can configure your AI models to blur-on-capture, where the video is never transmitted to the cloud in a readable format. Instead, the system only outputs the data packets needed for your KPIs. This allows you to tell your workforce and your legal team that you are not watching people, merely measuring the health of a process.
This distinction is critical for maintaining culture and compliance in a large enterprise.
Most downtime is not caused by one big machine failure, but by thousands of tiny delays throughout the day. These micro-delays, a misplaced tool or a slightly misaligned component, are often invisible to traditional tracking. Deep learning models produce the granular frequency data required to identify and eliminate these death by a thousand cuts scenarios.
This is the most direct path to a measurable return on investment across various use cases. Many of the safety and efficiency advancements seen in self-driving cars and other autonomous vehicles are now being applied to the warehouse floor. Whether in robotics, healthcare, augmented reality, or manual assembly, having a real-world feed of visual data means you stop managing by looking at yesterday's reports and start managing by responding to today's reality.
The primary value of computer vision lies in its ability to transform raw, unsearchable video into a high-velocity stream of structured metadata that acts as a bridge between your physical floor and your digital decision-making logic. By treating every frame as a searchable source of facts, you convert invisible operational friction into a measurable dataset that fuels your existing ERP and automation workflows. This shift from passive recording to active orchestration allows you to recover the margins currently lost to systemic inefficiency by responding to reality in real-time.
If you are ready to stop simply recording your operations and start acting on what your cameras already see, explore how we help enterprises deploy production-grade computer vision models.
Computer vision is an AI field that trains systems to interpret the physical world through digital images and video. Deep learning models process pixels and recognize patterns, converting visual inputs into structured data. For enterprise leaders, this means moving beyond passive recording to a system that can see, classify, and trigger automated responses to operational events in real time.
Computer vision systems primarily generate three data types: classification labels identifying what an object is, bounding box coordinates showing where it is, and confidence scores indicating probability of accuracy. Advanced systems also produce segmentation masks outlining exact object shapes, and object tracking data mapping movement paths. Output is typically structured as JSON or CSV for integration with existing data workflows.
Integration is achieved through an API-driven bridge that translates visual detections into business transactions. When the computer vision system identifies a specific event—like a finished product reaching the end of a line—it sends a digital request to your ERP or WMS. This request contains the metadata (product ID, timestamp) needed to update your records automatically. This streamlines inventory management by removing the need for manual scanning and manual data entry.
While the core algorithms remain similar, the datasets are tailored to specific real-world environments. In healthcare, medical imaging involves processing digital images like MRIs, CT scans, and X-rays to help with diagnoses. In logistics, the focus shifts to object recognition and tracking inventory across vast floors. Whether it is technology for self-driving cars or hospital triage, the system uses image processing to solve specific volume and accuracy problems.
Image processing refers to the digital manipulation of an image to enhance its quality, such as sharpening a blurry photo or adjusting contrast. Computer vision involves using artificial intelligence and machine learning to interpret and understand the content of those images. While image processing and initial preprocessing make a defect easier for a human to see, computer vision algorithms actually identify the defect and trigger an automated response.
The accuracy of your AI models is entirely dependent on the quality of the annotations (labels) provided during the training phase. If a human incorrectly labels a machine vibration as normal when it is actually a pre-failure state, the model will learn that error. In an enterprise setting, high-quality, human-verified data ensures the system stays accurate as your products, lighting, and camera angles change over time.
CNNs are the architectural backbone of most modern computer vision models. They identify patterns in layers — starting with simple edges and progressing to complex objects — mimicking how the brain processes visual information. In production environments, CNNs enable superhuman speed in quality control and feature extraction, making them essential for scaling visual operations in high-volume settings like manufacturing lines or retail checkout zones.